Population Pyramid

Figure 4: (Nationmaster)
As seen in this population pyramid, the bulk of the Dutch population is between the ages of 35-55, while the birth rate is steadily dropping each year. The large increase in population in the middle of the pyramid can be attributed to the post World War 2 baby boom. One interesting aspect of the population pyramid is the large number of 80+ females. This must be due to the high life expectancy of 83 years for Dutch women (79 for men) (CIA World Factbook).
Immigration
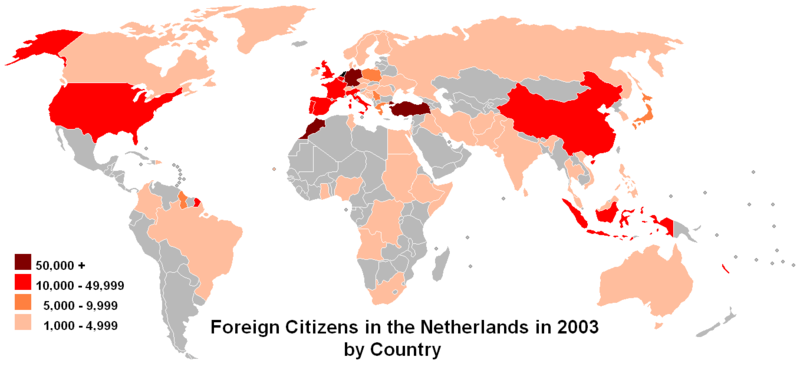
Figure 5: (Wikipedia)
There is considerable immigration to the Netherlands. In fact, due to the Total Fertility Rate (TFR) of 1.78 children born per woman, the yearly population growth of 0.452% (Indexmundi.com) can be attributed purely to immigration, without which the population would likely shrink.
As seen in the map (www.wikipedia.com), the majority of foreign citizens (presumably eventual citizens) come from Morocco and Turkey, with many from China, the U.S., Indonesia (a former colony), and the European Union.
As seen in the map (www.wikipedia.com), the majority of foreign citizens (presumably eventual citizens) come from Morocco and Turkey, with many from China, the U.S., Indonesia (a former colony), and the European Union.
Ethnic Composition
Figure 6: (http://www.lifeissues.net/writers/pry/images/34_4.gif)
82% of the Dutch population identifies itself as "Dutch only", while other visible minorities are Turkish, Surinamese, and Morrocan. These groups came to the Netherlands predominantly in the 1960s and 1970s as guest workers, who then stayed permanently (www.wikipedia.com).
DEmographic Transition
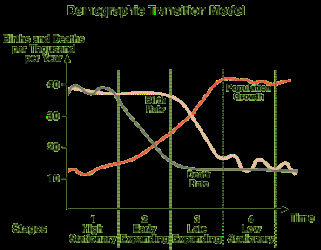
Figure 7: Wikipedia
Like most Western-European countries, The Netherlands has completed the demographic transition. The population growth is slowing down, death rate evening out and birth date dropping.
